Workshop 5. NGS Application Session 2 Workshop
In this workshop, we will perform the following tasks:
- Install software to perform the analysis
- Download sequences of the deduplicated reads and reference
- Build a bwa index of ribosomal RNA sequences
- Align deduplicated reads to the reference and convert to sorted BAM format
- Count 5’ alignments across the reference and write to file
- Compute enrichment scores using the 5’ alignment counts
- Plot the count and score distributions
- Filter and plot genomic sites that are the most likely methylation event candidates
Install software
We first must make the software packages we need available on the command line. Probably the easiest way to do this is to use miniconda.
Task - Install necessary software packages
Install the bwa, samtools, and bedtools command line programs in
your environment. If you are using miniconda, you may install these programs
with:
conda create -n hts_workshop python=3.6
source activate hts_workshop
conda install -c bioconda bwa samtools bedtools
Download sequences
The two sequence datasets we need are:
- the deduplicated read sequences from Workshop 2
- the ribosomal RNA sequences we will use as the reference
Deduplicated FASTA sequences:
https://ndownloader.figshare.com/files/9071635?private_link=455fcc63e1b3c8ffa0b3
Task - Download deduped sequences
Use wget to download the deduplicated sequences from the URL above. The
sequences are in zipped FASTA format. Use the unzip command to decompress
the files.
Genomic DNA sequences of select ribosomal RNA genes in zebrafish:
https://ndownloader.figshare.com/articles/5298121/versions/2
Task - Download ribosomal RNA sequences
Use wget to download the ribosomal RNA sequences. Use unzip to
decompress the files. In the archive there is a FASTA file, which will be
used to build the index, and a sizes file that we will use with bedtools.
Build a bwa index
We will use the ribosomal RNA FASTA file to build a bwa reference. Ribosomal
RNAs are known to be heavily methylated in humans, but less is know about the
prevalence and location of methylated residues in zebrafish, particularly in
development.
Task - Build a bwa index using the zerbrafish ribosomal RNA
sequences
Use wget to download the ribosomal RNA fasta file using the URL above.
Then run bwa index to see the usage information for how to build a bwa
index, and construct the appropriate command to build an index for the rRNA
sequences.
Align deduplicated reads
Once the index has been built, we can use it to align the deduplicated reads. Be careful not to run bwa without first redirecting standard out, specifying the appropriate command line argument, or combining the alignment with the next two samtools calls.
Task - Align the deduplicated sequences against the bwa rRNA index
Using bwa mem, align the DC-0517-2AL.10M_deduped.fasta.gz sequence file
against the rRNA index. Note: by default, bwa outputs the alignments in
SAM format to the command line. You may either use a command line option or
redirect stdout to save these alignments to a file.
Task - Convert the SAM alignments to BAM format and sort them using
samtools
Use samtools view to convert the SAM formatted alignments found by
bwa to BAM format. Then use samtools sort to sort the alignments.
Align all four of the deduplicated sequences separately.
HINT: You can use pipes to combine the bwa mem, samtools view, and
samtools sort commands together into a single command and avoid creating
redundant intermediate files.
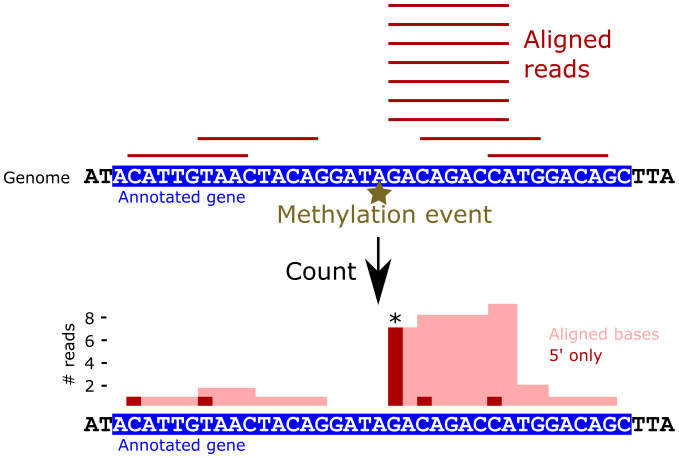
Count 5’ alignments
Now that we have sorted alignments in BAM format, we can use bedtools to
count the 5’ alignment positions across the entire reference. Counting reads by
only their 5’ alignment locations allows us to more easily identify individual
positions with high read mapping rates.
Task - Count the number of alignments per base position in the reference
Use the bedtools genomecov command to count the number of reads that map
to each base in the rRNA sequences. Examine the bedtools genomecov help
message to identify the option that makes bedtools count only the 5’ position
of each alignment. Also, be sure to supply the -d command line flag to
the bedtools call, to ensure that every base position is repoted, even
if there are zero reads. Save the output to a file named as you please.
The resulting file is a tab delimited file with three columns:
- sequence name
- sequence position
- number of reads
Compute enrichment scores
Recall that methylation events in this experiment may be detected when the reverse transcriptase stalls at modified residues. True events should therefore apear as a pileup of reads that map to exactly one location but are less prevalent in surrounding bases. We have devised a score to programmatically identify such events:
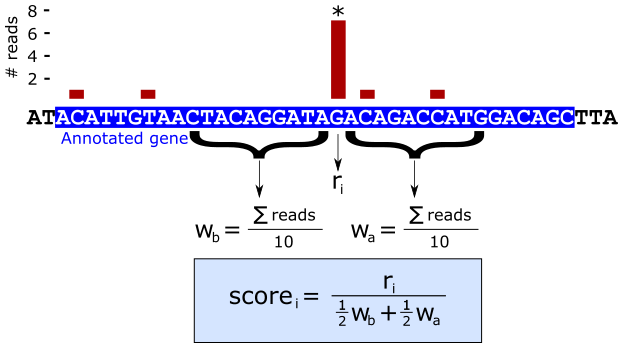
The score is a ratio of read depths, where \(r_i\) is the number of reads at genomic position i and, \(w_b\) and \(w_a\) are the average number of reads in the upstream and downstream windows of size n (in the above example, \(n = 10\)). The score is therefore defined as the number of reads at position i divided by the mean of the average read counts per base in the flanking windows. This unit-less score has a direct interpretation: when the score is equal to 1, there is the same average read counts at the given position as the flanking regions, indicating this location is not of interest. Therefore, scores substantially greater than one are putative methylation sites.
Note: When \(w_b = w_a = 0\) the score is set to zero.
In this task we will write a script that implements this score.
Task - Compute the 5’ window score for every valid position in the rRNA sequences
Using whichever tool you desire, compute the enrichment score for each valid position in the rRNA sequences using the 5’ read counts. There will be slightly fewer scores than base positions (why is this?).
Write a script that accepts a file on the command line that was created by
bedtools genomecov and writes out another file with the same format but
with the score instead of the counts.
Generate scores for each of the aligned samples.
Plot the count and score distributions
Now we are interested in the distribution of counts and scores across our samples. A boxplot can be useful for this purpose.
Task - Plot the distribution of 5’ read counts and scores across all rRNAs as boxplots
Using whichever tool you desire, read in and plot the 5’ alignment count distributions for the four samples. How do we interpret this plot?
Plot the distribution of scores for each sample in a boxplot. How do these scores compare to the 5’ counts?
Challenge: plot a scatter of the read count and corresponding score for all positions in the reference. What can we interpret from this plot?
Filter and plot genomic sites
As we saw in the boxplots, most genomic positions have counts and scores of zero. We would therefore like to identify sites that are potentially interesting by putting filters on the data. Recall that the low dNTP condition should be enriched for true sites, and therefore locations with high scores in the high dNTP condition are likely to be false positives. We have therefore devised a set of criteria to identify interesting sites using this knowledge.
Task - Filter and plot the 5’ window scores for low vs high dNTP concentration samples
Using whichever tool you desire, filter the score positions for low and high sample conditions within the same timepoint by the following criteria:
score_low > 2
score_high > 0
score_low > score_high
Using the remaining positions, create a scatter plot of scores where the low and high dNTP concentration samples are on the x-axis and y-axis, respectively. You may put a scatter for both time points on the same plot, or on separate plots as you wish.
Do the enriched sites agree between timepoints?